4 Commonly-used bullish and bearish reversal candlestick patterns
There are large number of reversal candlestick pattern in Technical Analysis. Today, we will discuss some of the most commonly and popularly used bullish and bearish reversal candlestick patterns. Here’s a list of commonly used reversal patterns.
Bullish Engulfing
Bullish engulfing is a two candlestick pattern with the first red and the second green candle. The size of the red candlestick is not that important, but it should not be a doji which would be relatively easy to engulf. The second should be a long green candlestick – the bigger it is, the more bullish. The green body must totally engulf the body of the first black candlestick. Ideally, though not necessarily, the white body would engulf the shadows as well. Although shadows are permitted, they are usually small or nonexistent on both candlesticks.
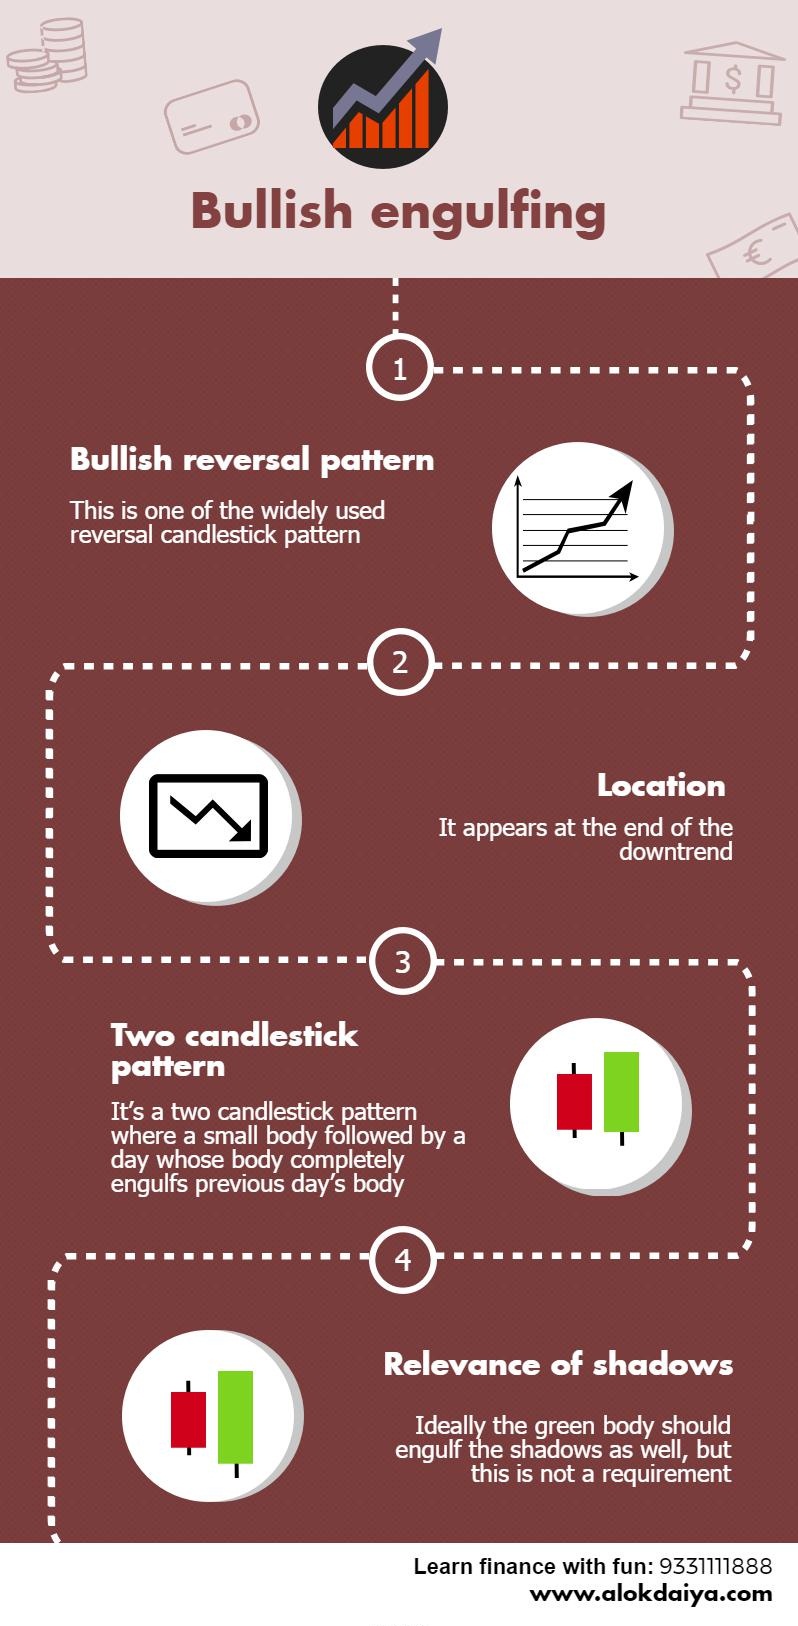
After a decline, the second green candlestick begins to form when selling pressure causes the security to open below the previous close. Buyers step in after the open and push prices above the previous open for a strong finish and potential short-term reversal. Generally, the larger the green candlestick and the greater the engulfing, the more bullish the reversal. Further strength is required to provide bullish confirmation of this reversal pattern.
Also read: Role of psychology in Stock Markets
Bullish Harami
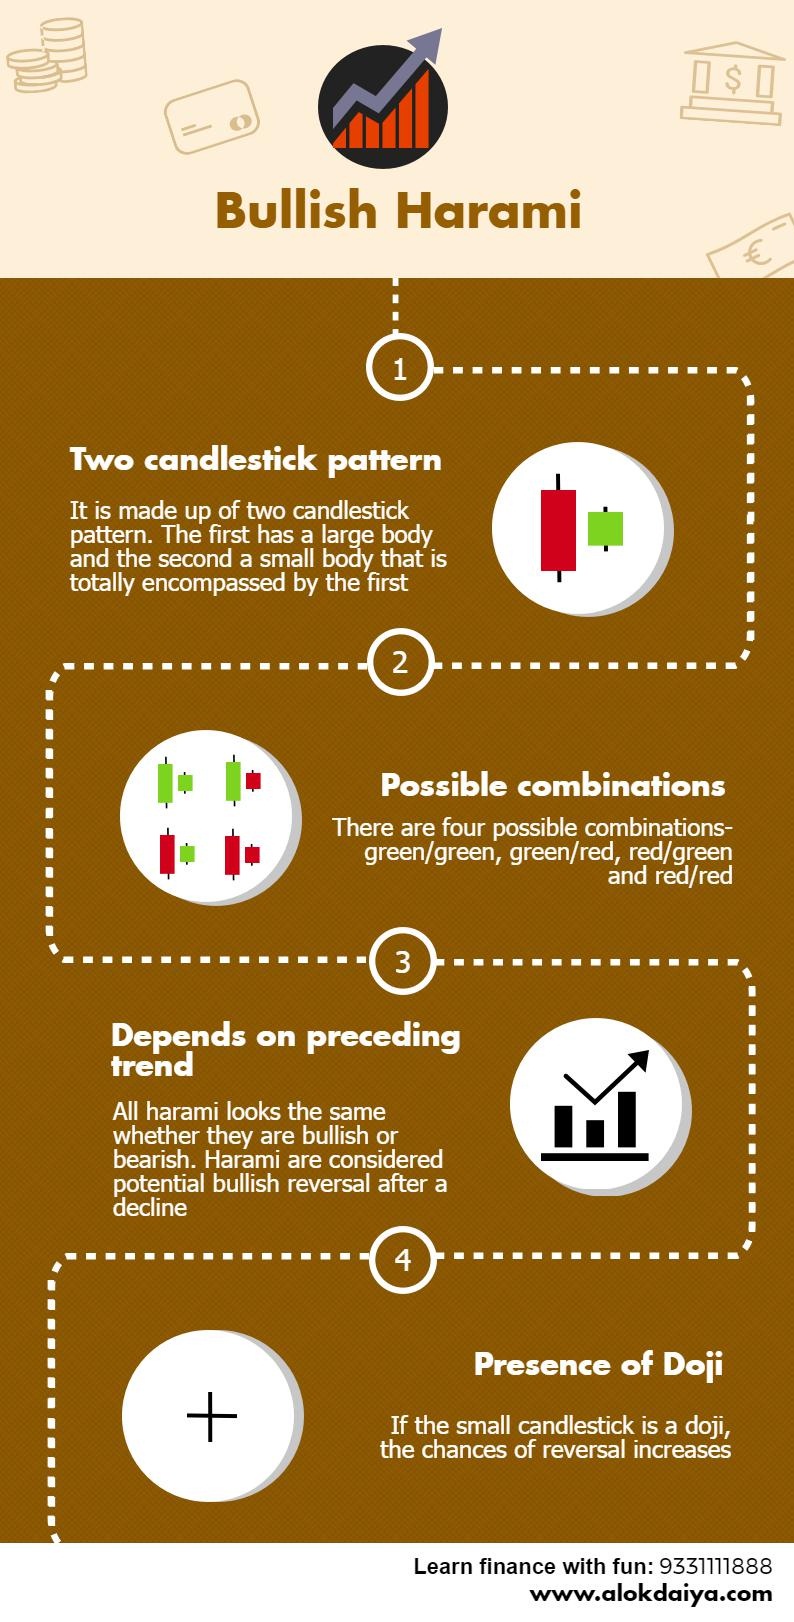
The bullish harami is made up of two candlesticks. The first has a large body and the second a small body that is totally encompassed by the first. There are four possible combinations: green green, green red, red green and red red. Whether they are bullish reversal or bearish reversal patterns, all harami look the same. Their bullish or bearish nature depends on the preceding trend. Harami are considered potential bullish reversals after a decline and potential bearish reversals after an advance. No matter what the color of the first candlestick, the smaller the body of the second candlestick is, the more likely the reversal. If the small candlestick is a doji, the chances of a reversal increase.
Bearish Engulfing
The bearish engulfing pattern consists of two candlesticks: the first is green and the second red. The size of the green candlestick is not that important, but should not be a doji, which would be relatively easy to engulf. The second should be a long red candlestick. The bigger it is, the more bearish the reversal. The red body must totally engulf the body of the first green candlestick. Ideally, the red body should engulf the shadows as well, but this is not a requirement. Shadows are permitted, but they are usually small or nonexistent on both candlesticks.
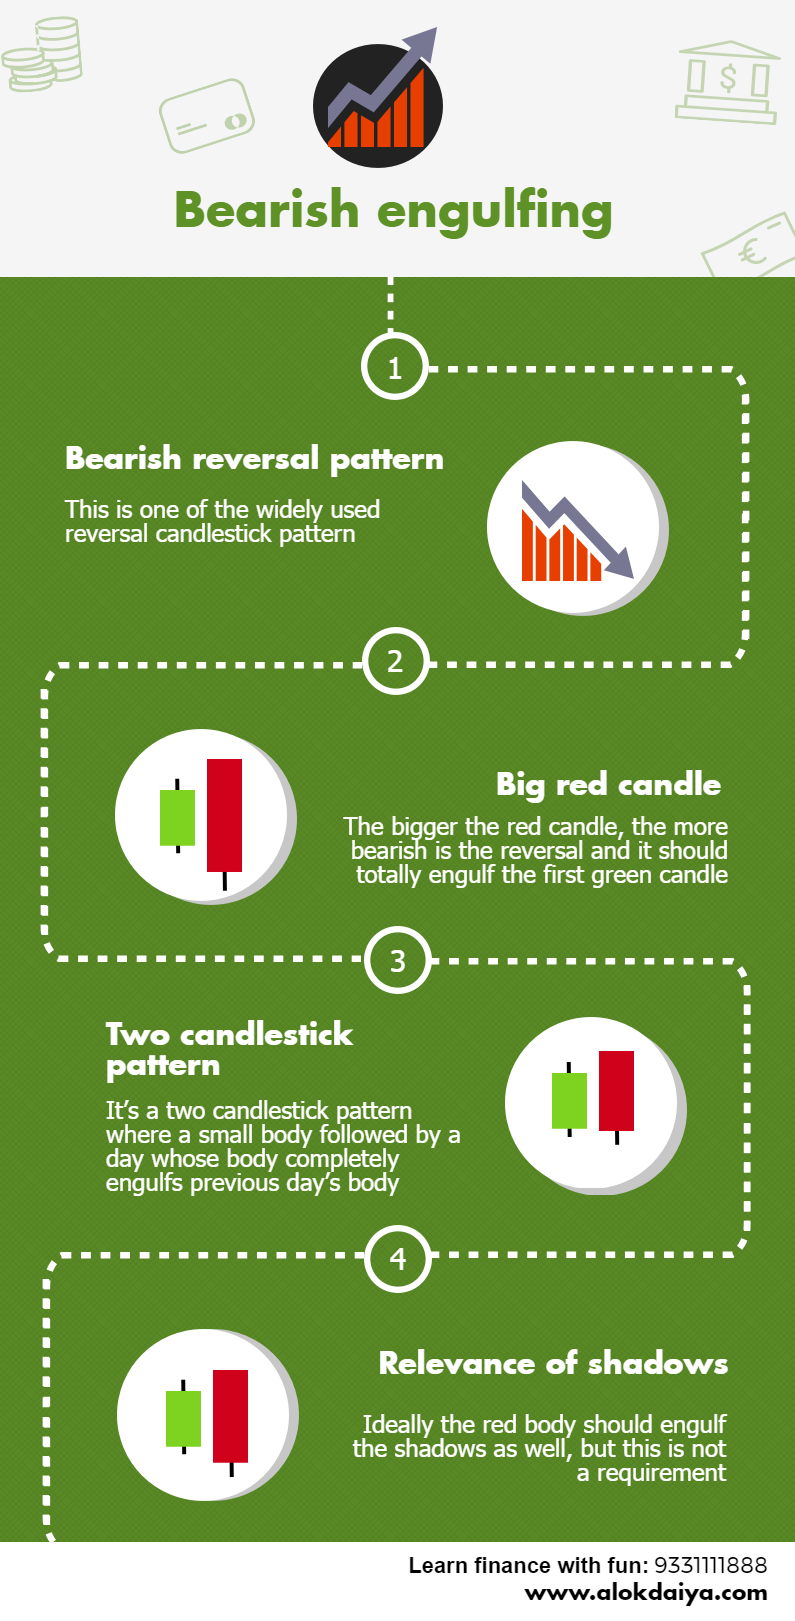
After an advance, the second red candlestick begins to form when residual buying pressure causes the security to open above the previous close. However, sellers step in after this opening gap up and begin to drive prices down. By the end of the session, selling becomes so intense that prices move below the previous open. The resulting candlestick engulfs the previous day’s body and creates a potential short-term reversal. Further weakness is required for bearish confirmation of this reversal candlestick pattern.
Bearish Harami
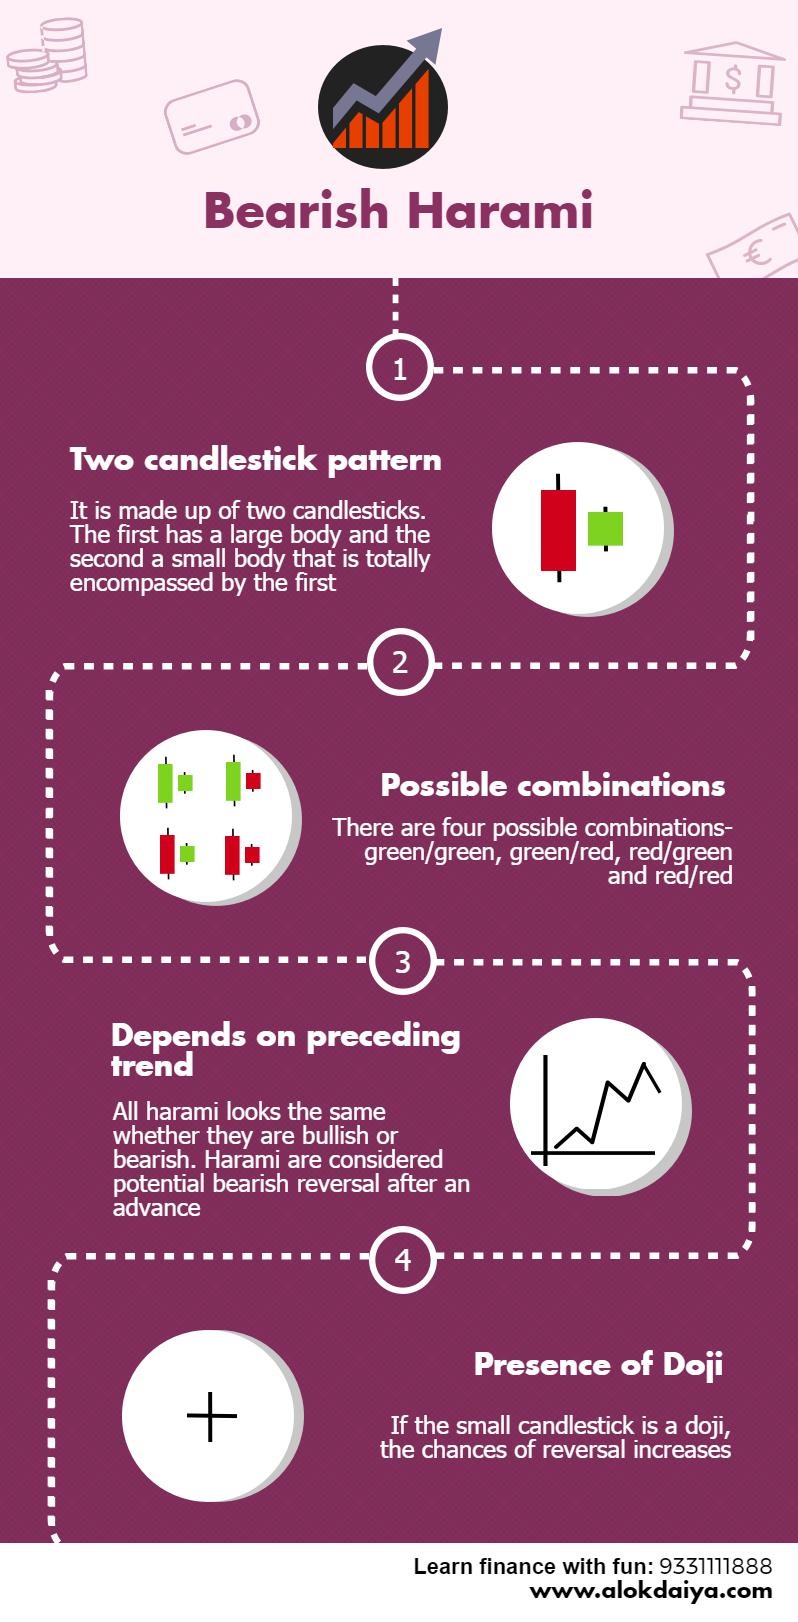
The bearish harami is made up of two candlesticks. The first has a large body and the second a small body that is totally encompassed by the first. There are four possible combinations: green green, green red, red green and red red. Whether a bullish reversal or bearish reversal pattern, all harami look the same. Their bullish or bearish nature depends on the preceding trend. Harami are considered potential bearish reversals after an advance and potential bullish reversals after a decline. No matter what the color of the first candlestick, the smaller the body of the second candlestick is, the more likely the reversal. If the small candlestick is a doji, the chances of a reversal increase.
Conclusion
Even though these are some of the most commonly used candlestick pattern in the traders community but just the formation of it cannot guarantee subsequent movement. You should not simply rely on the same, rather used it in conjunction with other technical parameters to confirm your trading signal.


