How to generate reversal signal using Hammer and related candlestick pattern?
Most traders consider candlestick charts to be more visually appealing and easy to interpret as compared to traditional bar charts. Moreover, the traders get a quick overview of Open, High, Low and Close data simply by looking at the candle.
There are large number of candlestick patterns which are looked upon by the traders on a regular basis but the most commonly used candlestick patterns includes Hammer, Hanging man, Inverted Hammer and Shooting star pattern. All of this are very much look alike but they have a different implication at various location in the price chart.
Understanding of different Candlestick patterns
Now we will study them in little detail and also understand their significance. These are basically two pair of candlestick reversal pattern made up of small real body, one long shadow and very short to non-existent wick. They are classified simply on the basis of preceding price action and location of long shadow.
The first pair includes Hammer and Hanging Man which consists of identical candlesticks with small bodies and long lower shadows. The second pair includes Shooting Star and Inverted Hammer, also contains identical candlesticks, except, in this case, they have small bodies and long upper shadows. The bullish or bearish nature of these candlesticks gets confirmed only by previous price action and further confirmation. The Hammer and Inverted Hammer form after a decline and are bullish reversal patterns, while the Shooting Star and Hanging Man form after an advance and are bearish reversal patterns.
Hammer and Hanging Man
The Hammer and Hanging Man are exactly same with the looks, but have different implications based on the preceding price action. Both the candle have small real bodies (either green or red), long lower shadows and short or non-existent upper shadows.
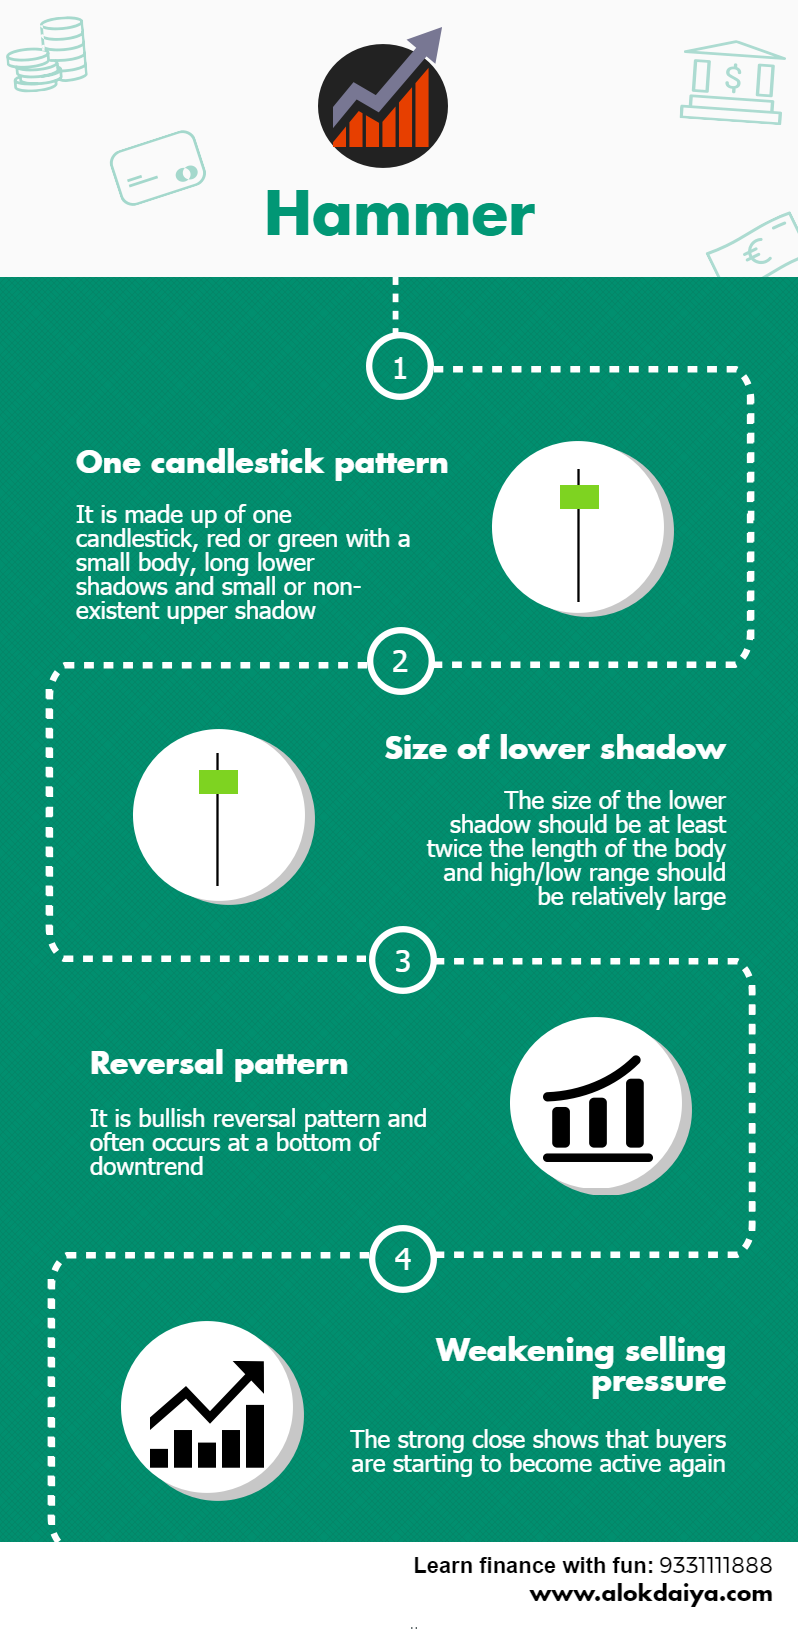
Unlike other candlestick pattern, the previous move is very important with both Hammer and Hanging Man. Hammer is a bullish reversal pattern which is seen after a long decline and it also marks probable bottoms or support level. The hammer symbolises bullish revival since it indicates that the bears are trapped (denoted by long low) and may end up covering their short position resulting in aggressive buying. However, we may need confirmation in the form of expansion of volume, gap up or presence of long green candle which provide validity of the reversal.
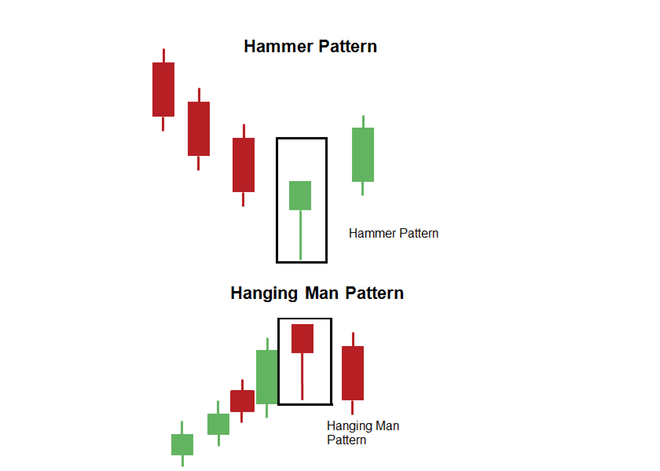
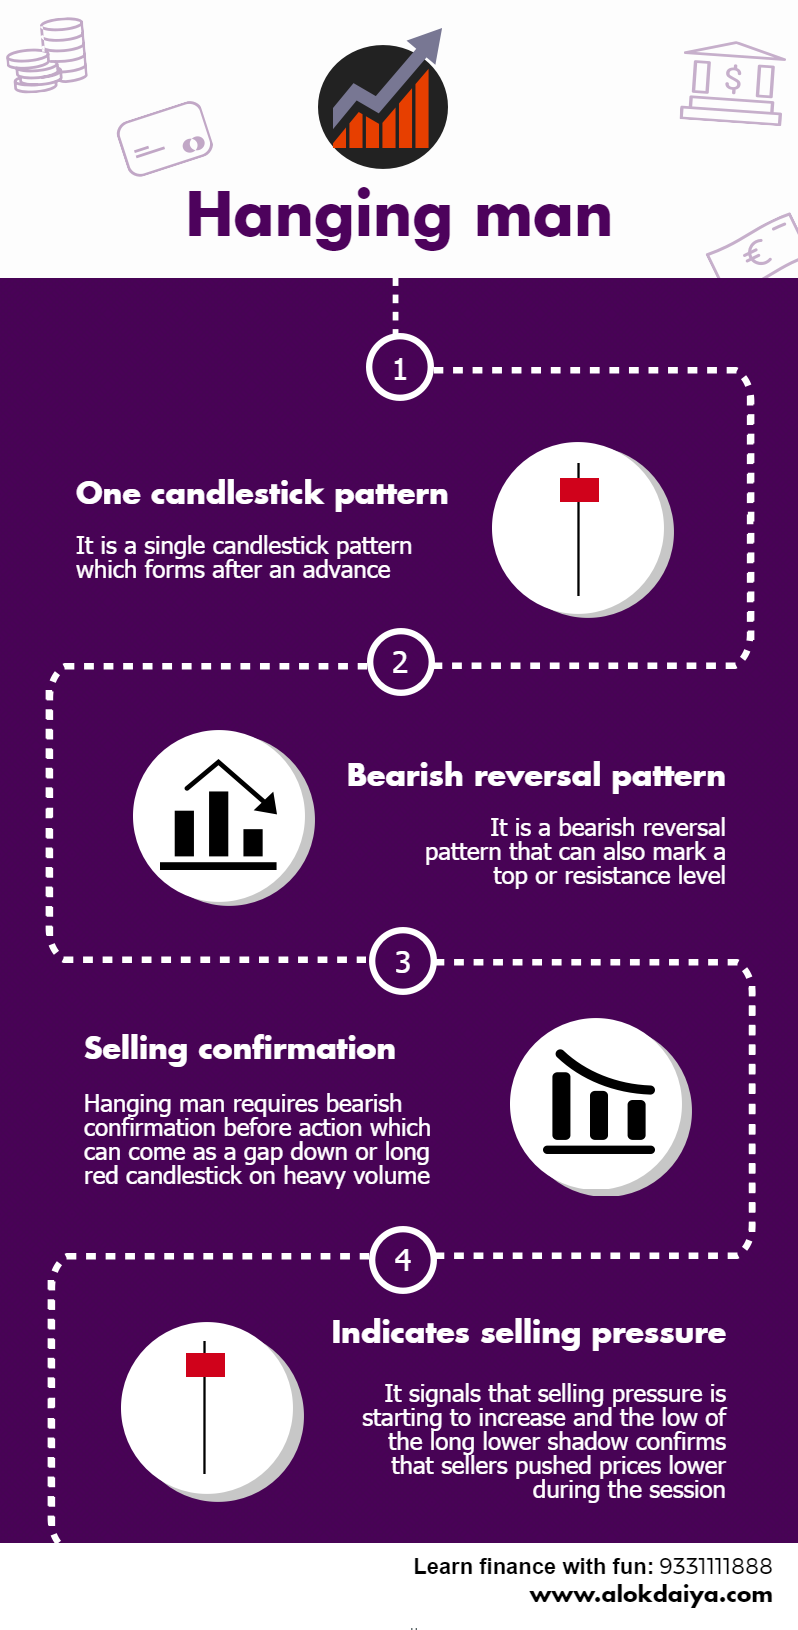
On the other hand, Hanging man is a bearish reversal pattern which marks probable top or resistance. After a strong up move, the appearance of Hanging man suggests that the selling pressure is about to go up. Even though after making the long low, the price closed higher but the selling pressure raised a question mark on the existing uptrend. However, unlike Hammer pattern, here also we require confirmation which can be in the form of gap down or long red candle on increased volumes.
Invertes Hammer and Shooting Star
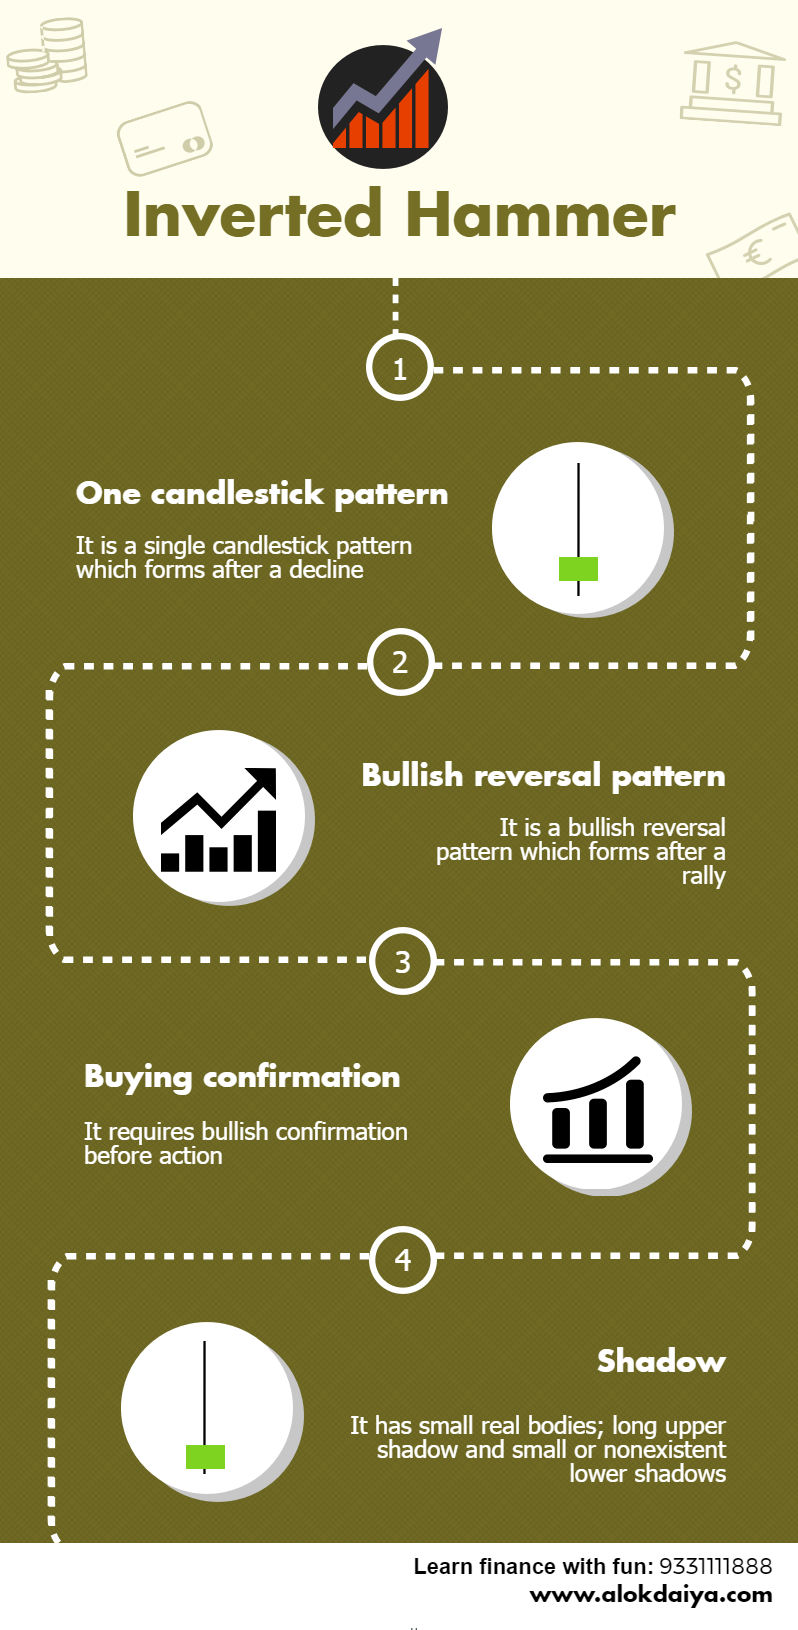
The Inverted Hammer and Shooting Star look similar, but have different implications based on previous price action. Both candlesticks have small real bodies (red or green), long upper shadows and small or nonexistent lower shadows. These candlesticks also mark potential trend reversals, but you need a proper confirmation before taking positions.
The Shooting Star is a bearish reversal pattern that forms after a long uptrend. A Shooting Star can mark a potential trend reversal or resistance level. The simple logic behind this pattern is that after making a long high, the stock closed almost near the bottom of candle thus trapping the bulls. This may result in aggressive unwinding of long position and end up long covering thus pushing prices lower.
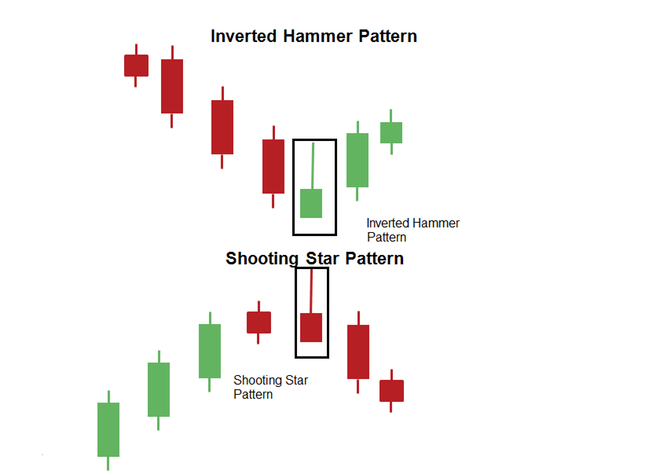
Bearish confirmation in the form of a gap down or long red candlestick on heavy volume signals the probable downtrend.
The Inverted Hammer is a exact look alike of a Shooting Star, but forms after a downtrend. Inverted Hammers represent a potential trend reversal or support levels.
Even though after making the long high, the price closed lower but the selling pressure raised an eyebrow on the existing downtrend. However, unlike Hammer pattern, here also we require confirmation which can be in the form of gap up or long green candle on increased volumes.
Conclusion
There are other candlestick patterns which works equally well in the market which we will discuss in the coming blog. However, trading simply on the basis of mere candlestick pattern is not enough but you need to get confirmation from other patterns or indicators to confirm your trade.
You may also like

Financial Terminologies Starting with “L”

Financial Terminologies Starting with ‘K’
3 Comments
Nice article
Amazing??
This is undoubtedly the best and simplified blog to understand
Reversal patterns.
Waiting for the upcoming blogs✌?
Make a more new posts please 🙂
___
Sanny