How to generate trading signal using RSI?

Relative Strength Index was developed by j. Welles Wilder in the year 1977 and is a momentum based oscillators which measure the speed and change of price movement. The full abbreviation of RSI stands Relative Strength Index or indicator.
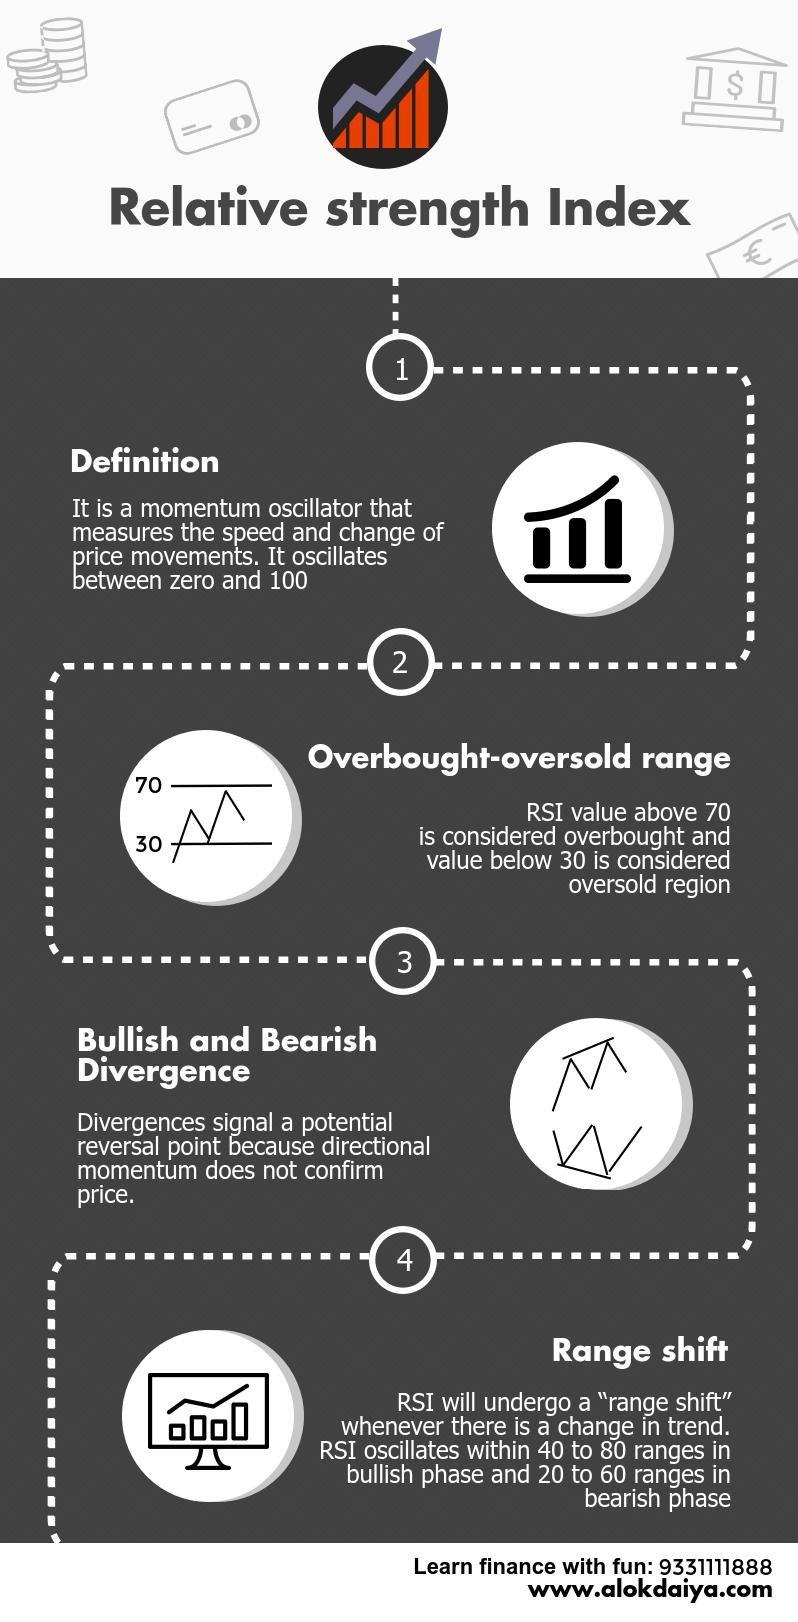
RSI is plotted on a vertical scale between 0 and 100. Above 70, the zone is defined as overbought and below 30, the zone is called oversold. In simple words, it basically measures relative strength of a particular stock over a given period of time.
Formula for calculating Relative Strength Index (RSI)
- RS= Average of 14 days higher close/Average of 14 days lower close
- RSI= 100 – 100/ (1 + RS)
Also read: Importance og Gap theory in Technical Analysis
Let us note that at any point of time, the value of RSI cannot be greater than 100 and cannot be less than 0. The default parameter in RSI is taken as 14, but it can be lowered or increased to change the sensitivity according to your trading need. Say the 10 period RSI is likely to reach oversold-overbought region more quickly than 20 periods RSI.
Trading rules
1. Relative Strength Index should never be looked into or used in the daily chart. It does not measure any short term momentum; hence it is to be used always in the weekly chart.
2. When Relative Strength Index comes below 30, it defines that the situation is oversold and selling should preferably be avoided.
3. When Relative Strength Index moves above 30, it again creates a buy signal, showing that upside momentum has started working in.
4. When RSI reaches above 70, it defines that the situation is overbought and buying should be avoided as much as possible. When RSI starts falling downside from 70 above, it defines that situation is overbought and upside momentum has turned to downside. Between 30 and 70, the zone is called neutral zone and RSI is expected to follow the direction of the price during this time.
5. The most important information of Relative Strength Index is divergence; may it be positive or negative.
6. A divergence in Relative Strength Index should never be ignored. Once again we have to keep in our mind that RSI does not measure any short term momentum, hence it should be used in the daily chart rather always in the weekly chart.

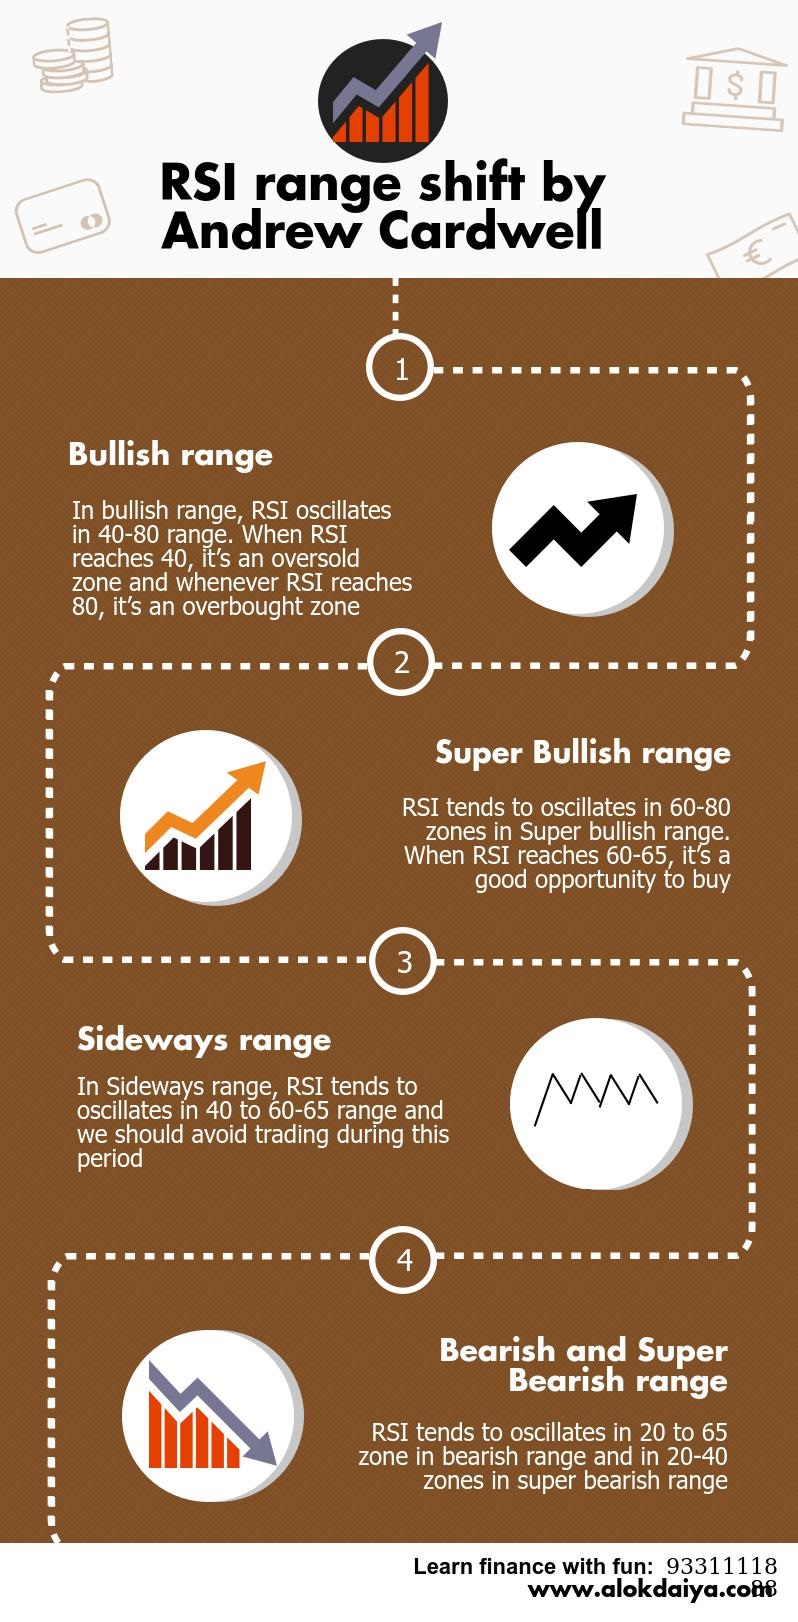
Range shift
Constance Brown suggests that oscillators do not travel between 0 and 100. Brown identifies a bull market range and a bear market for Relative Strength Index. It tends to fluctuate between 40 and 80 in a bull market (uptrend) with the 40-50 zones acting as support. These ranges may vary depending on RSI parameters, strength of trend and volatility of the underlying security.On the other hand, it tends to fluctuate between 20 and 60 in a bear market (downtrend) with the 50-60 zone acting as resistance.
Conclusion
Short-term traders uses 2-period Relative Strength Index to look for overbought and oversold condition. You can change your parameter to suit your trading need. Say the traditional idea as 70 as overbought and 30 as oversold can be used by the analyst for better analytical requirement. Simply by changing the overbought and oversold levels can affect the number of overbought and oversold reading.
Doing trades based on RSI would not be a good idea, rather it should be used in conjunction with other technical indicators and pattern to generate more accurate trading signals.
You may also like

Financial Terminologies Starting with “L”

Financial Terminologies Starting with ‘K’
3 Comments
Make a more new posts please 🙂
___
Sanny