How to generate trading signals using Stochastics?
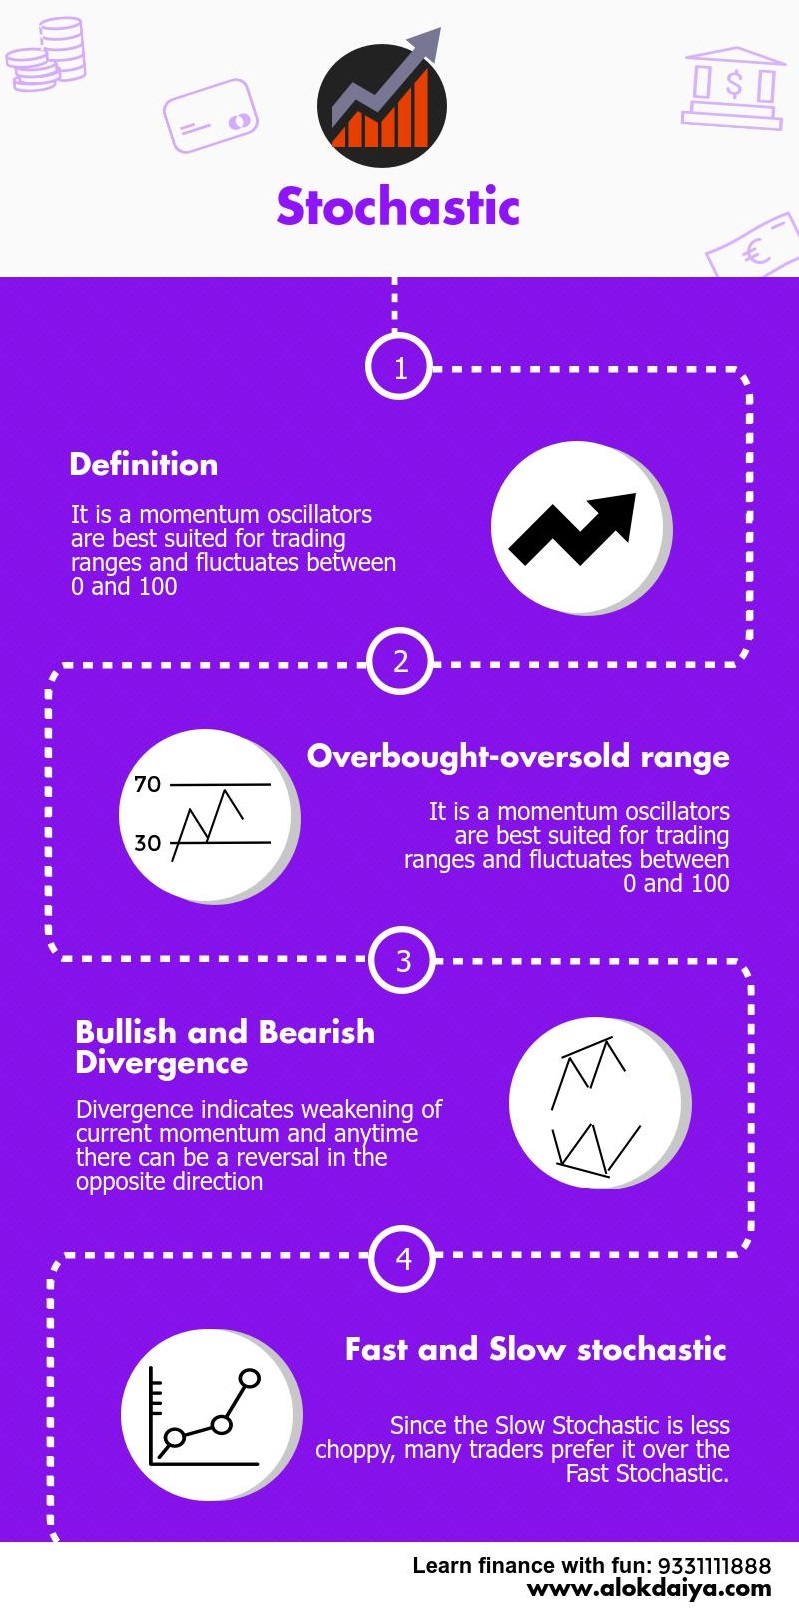
Stochastic is basically a combination of statistics and mathematics. It is an oscillator that was developed by George lane. Stochastic is a momentum based indicator which identifies the location of the present closing price relative to its range over a set number of periods.
The difference between Stochastic and RSI is sensitivity. When we use RSI, we use smoothed data. As the data are smoothed, its ability to respond to price fluctuations becomes lower.
Time frame and sensitivity
Apart from that RSI is used on the weekly chart i.e. we use longer time frame data to find out the performance of RSI. We must note that as RSI is less sensitive to price fluctuations, it is no use to apply RSI on the daily chart.
On the other hand, we have stochastic which basically uses raw data unlike RSI. It considers last 5 days data only and therefore it is used on the daily chart. The main purpose of using Stochastic on the daily chart is to understand the short term fluctuations. As we use raw data in Stochastic and do not smoothen it, hence it is highly sensitive to short term price fluctuations. This is the reason why stochastic should be used in the daily chart.
Calculation
The computation process begins as follows-
RSI is made up of single line whereas Stochastic is made up of 2 lines. They are known as %K and another line is called %D.
%K = 100[(C – L14) / (H14 – L14)]
Where,
C = the recent closing price
H14 = the highest price traded during the same 14-day period.
L14 = the low of the 14 previous trading sessions
%D= 3 days average of the %K. Hence %D does not exist on its own identity rather it is derived from %K.

Trading rules
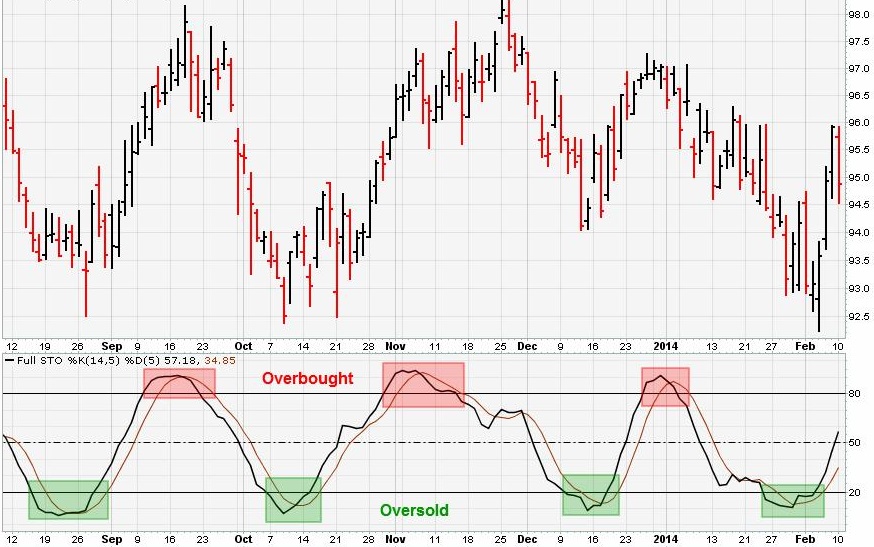
1. Stochastic is plotted on a vertical scale between 0 to 100. Above 80, it is overbought and below 20, it is oversold.
2. Stochastic should always be applied on the daily chart to understand the short term fluctuations.
3. During an uptrend, to show the upward momentum is intact, % K will be greater than %D and both will rise together.
4. %K is plotted as a solid line and %D line is plotted as a dotted line. %D line is also called trigger line.
5. During a downtrend to check if the downward momentum is intact, %K line will be lesser in value than the %D line and both will continue to fall.
6. When both the line %K and %D, goes above 80, it tells us that market is overheated for a shorter term and a correction is likely to occur.
7. As long as %K and %D, both remained above 80, it tells that the market is overheated but we have to wait for a sell signal to occur.
8. Once %K and %D starts falling from 80, it gives us a sell signal.
9. When both %K and %D line goes below 20, it indicates an oversold situation. An oversold situation tells us to remain alert as far as selling is concerned, but does not necessarily produce a buy signal.
10. A valid buy signal will occur when both the lines starts going up from below 20

11. 20-80 range is called neutral zone.
12. In between 20 and 80, stochastic may produce a fresh buy or a fresh sell signal as both the line cuts each other. This signal in between the neutral zone is equally valid and should not be ignored.
13. The main lesson what we get from Stochastic is to avoid buying decision even if for a shorter term when Stochastic is above 80.
14. Avoid a selling decision as much as we can when the stochastic is below 20.
15. Stochastic will always help us to understand the short term momentum lasting for a period of 5 days or more.
16. RSI is used for investment purpose while stochastic is used for trading purpose.


