Identify trend reversal signal using variations of Doji patterns
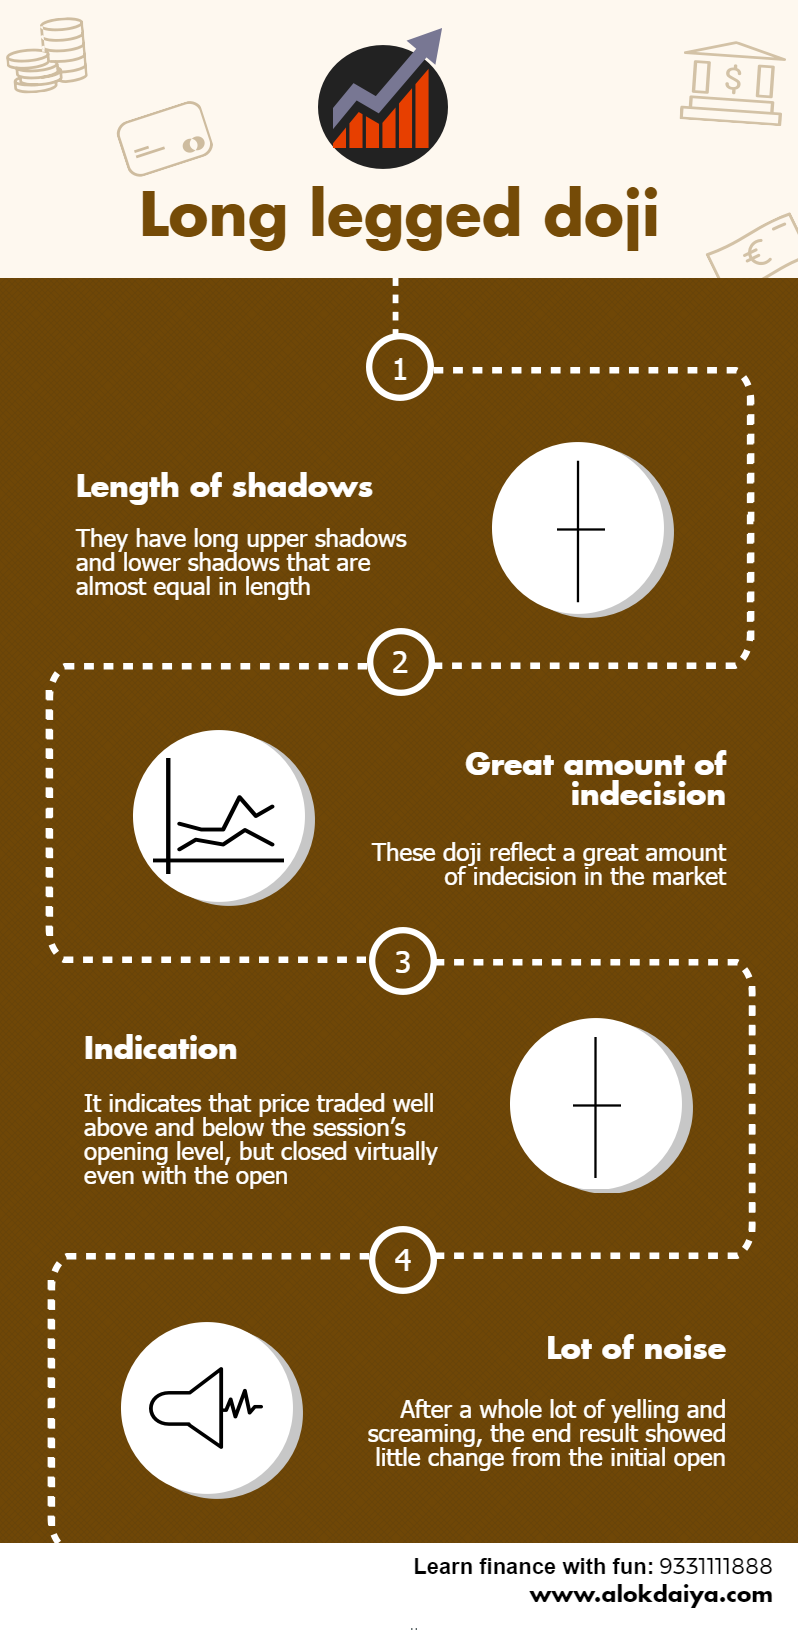
The Doji is one of the most powerful signals in Candlestick trading which simply indicates that the bulls and the bears are at equilibrium (i.e. a state of indecision). The appearance of it at the end of an extended trend, has significant implications. The trend may be ending and it is one of the most predominant reversal indicators. It is very effective in all-time frames, whether using a one-minute, five-minute, or fifteen-minute chart for day trading or daily, weekly, and monthly charts for the swing trader and long-term investor.
Doji star
Upon seeing a Doji in an overbought or oversold condition, an extremely high probability reversal situation becomes evident. Overbought or oversold conditions can be defined using other indicators such as stochastics, When it appears, it is demonstrating that there is indecision now occurring at an extreme portion of a trend. This indecision can be portrayed in a few variations of the Doji.
Long legged doji
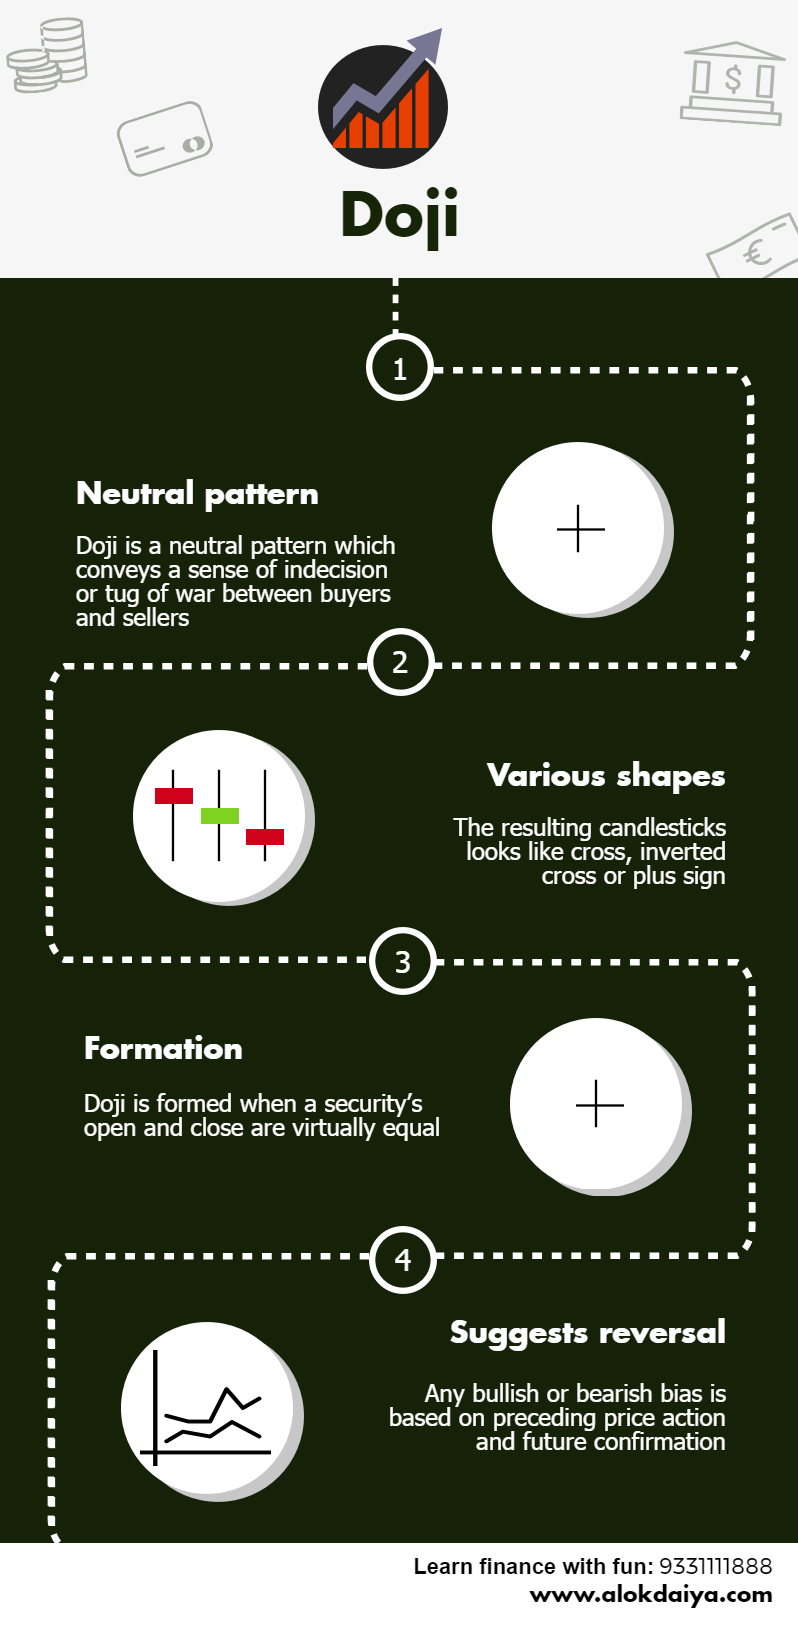
The Long-legged Doji is composed of long upper and lower shadows. Throughout the time period, the price moved up and down dramatically before it closed at or very near the opening price. This reflects the great indecision that exists between the bulls and the bears.
Also read: How to generate trading signal using RSI?
Gravestone doji
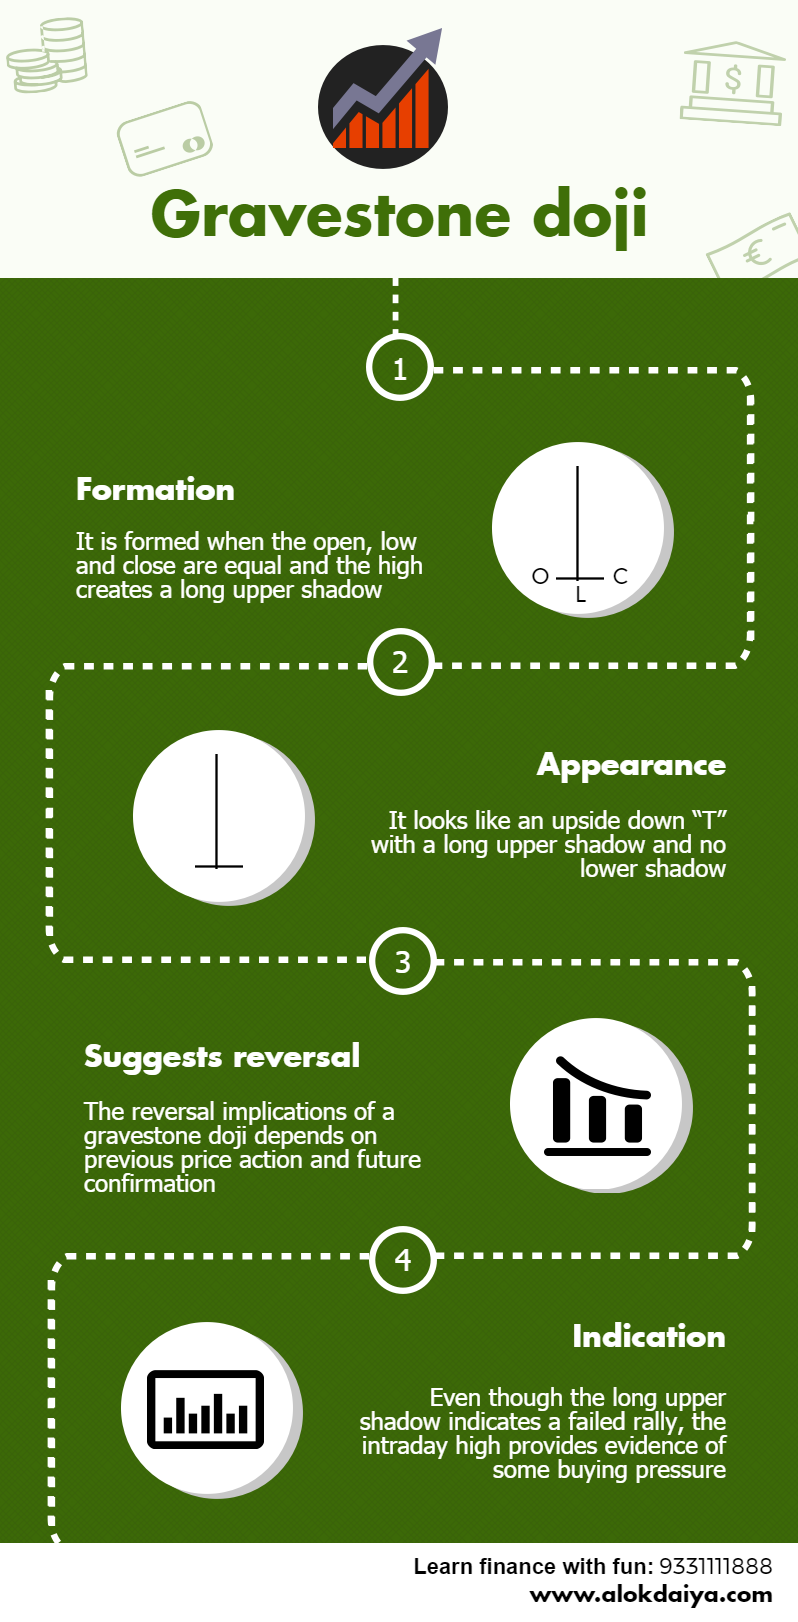
It is formed when the open and the close occur at the low end of the trading range. The price opens at the low of the day and rallies from there, but by the close the price is beaten back down to the opening price. The Japanese analogy is that it represents those who have died in battle. The victories of the day are all lost by the end of the day. A Gravestone Doji, at the top of the trend, is a specific version of the Shooting Star. At the bottom, it is a variation of the Inverted Hammer.
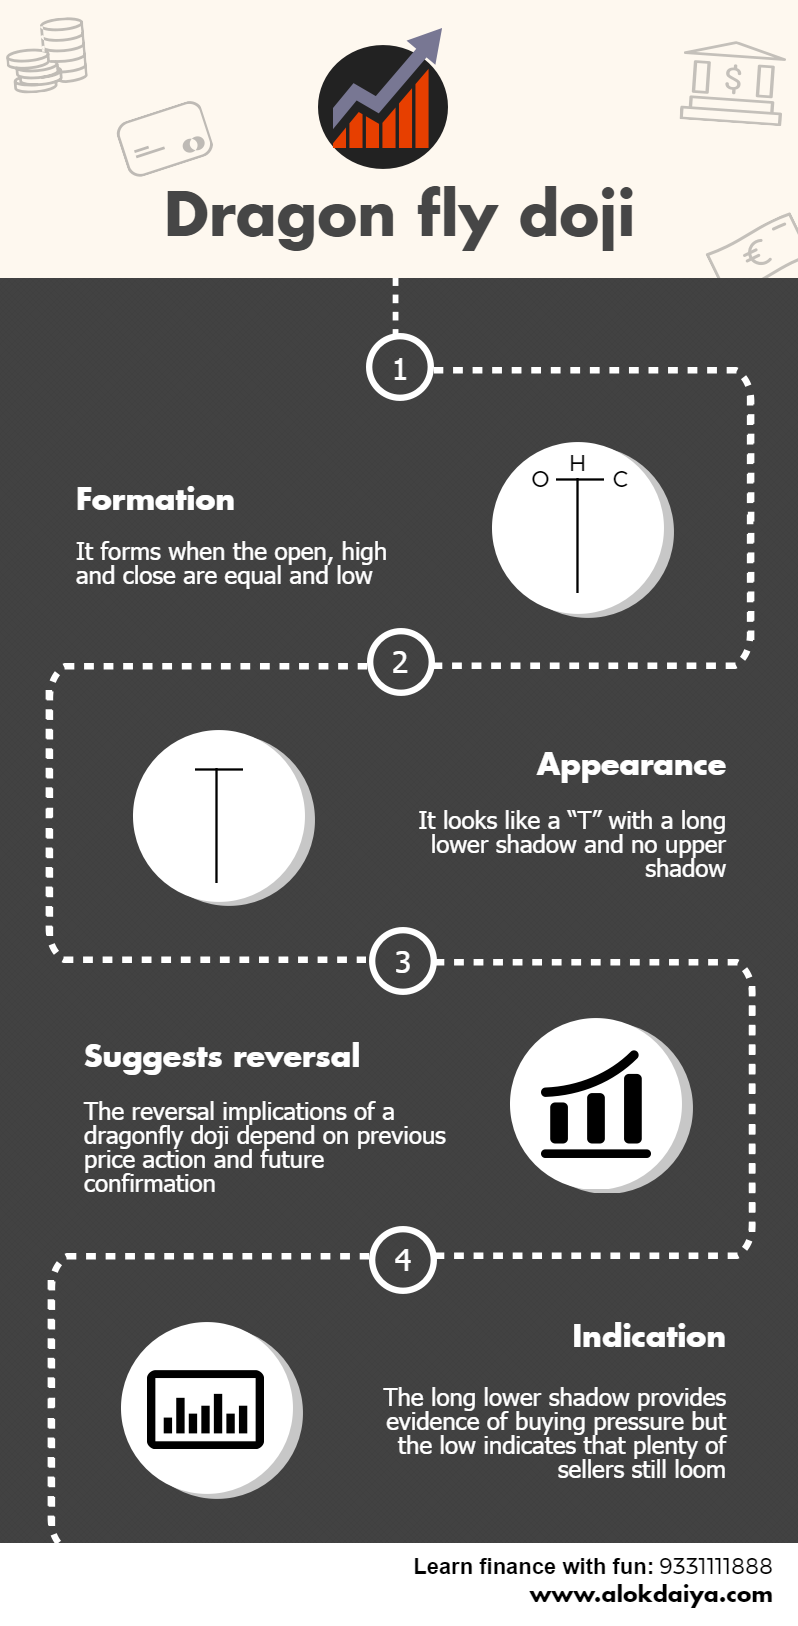
Dragonfly doji
It occurs when trading opens, trades lower, then closes at the open price which is the high of the day. At the top of the market, it becomes a variation of the Hanging Man. At the bottom of a trend, it becomes a specific Hammer. An extensively long shadow on a Dragonfly Doji at the bottom of a trend is very bullish.
Conclusion
Having the knowledge of what it represents, indecision, allows the Candlestick analyst to take advantage of reversal moves at the most opportune levels. Regardless of whether you are trading long-term holds for day trading from the one-minute, five-minute, and fifteen-minute charts, it illustrates indecision in any time frame.


