Role of Oscillator in stock market
In technical analysis, oscillators are known as momentum indicator. We should keep in our mind that momentum is an indispensable part of a trend. A trend is made up of direction and momentum. A direction might be linear whereas a momentum is cyclical. A direction may remain unchanged for a longer time, but a momentum may not be linear. At a particular point of time, momentum may halt for some time. Oscillators are the indicators which measures momentum.
Oscillators
Oscillators keep on oscillating between the two extremes. The upper extreme is called overbought and the lower extreme is called oversold. So an oscillator keeps on oscillating between these 2 extremes. An overbought level has been defined as unsustainable level of optimism.
When the share price rise too much at a point of time, oscillators shows that the situation is unsustainable and momentum needs to travel to the opposite side. Likewise, we can have over sold situation. It is a situation which can be explained by unsustainable level of pessimism. When prices starts falling in a downtrend and it comes to such a level where the downtrend is awfully overstretched, the momentum needs to travel to the opposite direction and this is how the oscillators works.

The general understanding of the fact is that one should not buy in an overbought situation and one should not sell in a oversold situation. Oscillator also gives us important information which is called divergence. Let us note that divergence is the most crucial part of an oscillator which should not be ignored.
Divergence
A divergence is basically a mismatch between the movement of the price and the movement of the oscillators. We can say it is a disagreement between the directional movement of the price and the directional movement of the oscillator.
Types of Divergence
Divergences are of two types-
1. Positive divergence or bullish divergence
2. Negative divergence or bearish divergence

Bullish or Positive divergence
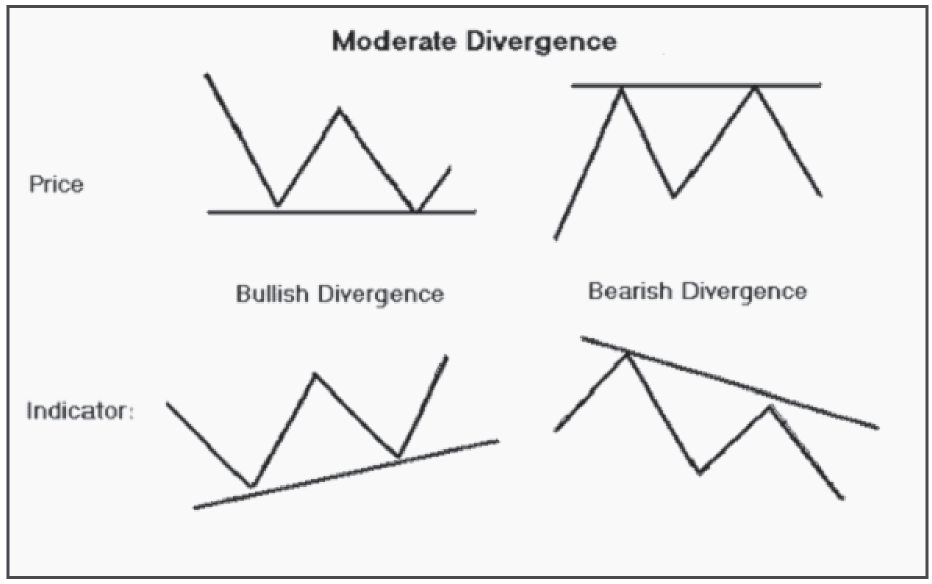
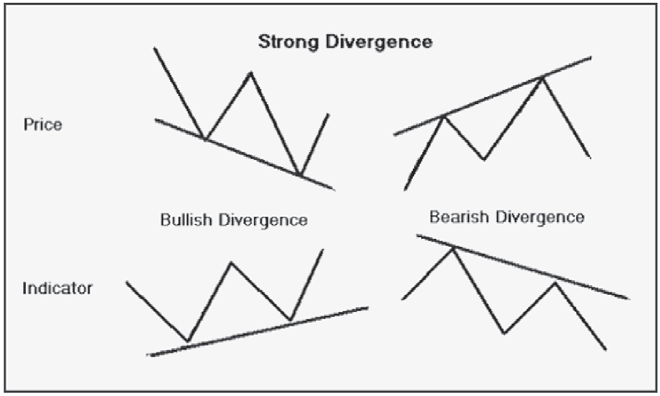
A positive divergence will always occur after a downtrend. In a positive divergence, price keeps on making lower low and in spite of making that lower low, oscillator refuses to make any new lower low. And this can be of two types.
a. Price making lower bottom, oscillator making higher bottom
b. Price making lower bottom, oscillator making double bottom
In any case, prices going lower but oscillator refuse to go lower.

And this mismatch is called positive divergence. It will always occur after a downtrend. The message we get from a positive divergence is that although price is going lower but the refusal of oscillator suggests that downside momentum is exhausted and whatever price is falling, it is out of inertia only. At any moment of time, prices may take U-turn and go up. Hence it is not advisable to make fresh selling, when there is a positive divergence. Let us note that all positive divergence are an advanced signal of a change in the trend from down to up. That is why the oscillators are also called advanced indicator.
Bearish or Negative divergence
A negative divergence will always during an uptrend and it has a negative implication.
Negative divergences are of two types-
a. Price making higher top, oscillator making lower top
b. Price making higher top, oscillator in comparison makes double top
Although price is trying to exhibit strength by making a higher top but this is supported by oscillator as it tells us that upside momentum of the price is diminishing and anytime the reversal is possible. The basic assumption of negative divergence is not to buy when such things occur. We must note that when there is a divergence in the oscillator, it’s an early signal of trend reversal and should not be ignored.
Conclusion
An oscillator can act as an alert to study price action a little more closely and are used to confirm other technical analysis tools.. If momentum is waning, it may be a signal to watch for a break of support. Or, if there is a large positive divergence building, it may serve as an alert to watch for a resistance breakout.
Oscillators are most effective when used in conjunction with pattern analysis, support/resistance identification, trend identification and other technical analysis tools.


