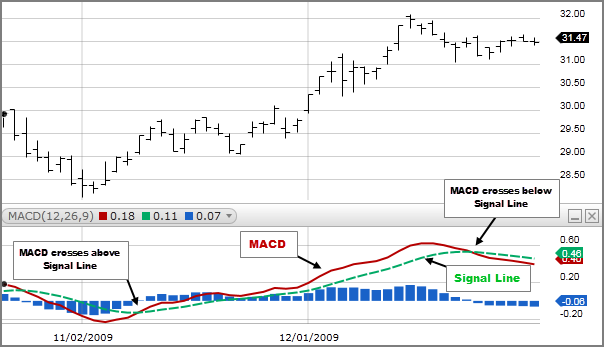
Trading simplified using MACD indicator
MACD is one of the simplest and most effective momentum indicators which was developed by Gerald Appel in the late seventies. The MACD turns two trend-following indicators, moving averages, into a momentum oscillator by subtracting the longer moving average from the shorter moving average
It is simply a trend following indicators which is much more advanced than moving average in nature. MACD is plotted on a vertical scale, which is made up of two lines. One line is called solid line or MACD line. The other line is called trigger line or dotted line.
Interpretation
As its name implies, the Moving Average Convergence and Divergence is all about the convergence and divergence of the two moving averages. Convergence occurs when the moving averages move towards each other. Divergence occurs when the moving averages move away from each other. The shorter moving average (12-day) is faster and responsible for most MACD movements. The longer moving average (26-day) is slower and less reactive to price changes in the underlying security
Computation
1. Calculate 26 days exponential Moving average of any particular stock
2. Calculate 12 day exponential moving average of the same stock.
3. Subtract 26 days EMA from 12 EMA i.e. 26 EMA has to be subtracted from 12 EMA. Suppose the result is “x” and this “x” is to be plotted as MACD line or solid line.
4. Again calculate 9 days exponential Moving average of “x” and the result we get is called “y”. This “y” line is known as dotted line or trigger line.
Also Read: How to generate trading signal using RSI?

Trading rules for MACD
1. MACD is plotted on the vertical scale where zero is the central reference line. Above zero, the zone is called bullish and below zero the zone is called bearish. We should note that this zone is very important in its calculation. Some people call it above zero, a positive territory and below zero is a negative territory.
2. During an uptrend, MACD line will be greater than dotted line and both will rise but again we have to consider the zone. If MACD lines are rising below zero, then this is not a valid buy signal because the zone is negative.
3. In order to make a valid buy signal, both the line has to go above zero.
4. In a downtrend, MACD line will be less than dotted line and both will fall. But we have to see the zone where it is falling. If this fall occurs, above zero, i.e. in the bullish zone, then it is not a perfect signal of a downtrend. One should wait for both the line to cross below zero in order to generate a valid sell signal.
5. We must note that a positive signal in the positive territory in much attractive and a bearish crossover in the negative zone is equally meaningful.
Bottomline
Just like RSI or Stochastic, divergences are also seen here when the MACD diverges from the price action of the underlying security. A bullish divergence forms when a security records a lower low and the MACD forms a higher low. The lower low in the security affirms the current downtrend, but the higher low in the MACD shows less downside momentum.
It is an unique indicator since it brings together momentum and trend in one indicator. This unique blend of trend and momentum can be applied to daily, weekly or monthly charts. The standard setting for MACD is the difference between the 12 and 26-period EMAs. However, traders may change sensitivity by changing the parameter of shorter short-term moving average and longer long-term moving average.


