Two strong price reversal patterns commonly used by traders

In Technical Analysis, there are a number of classical chart patterns which includes triangle pattern, rectangle patterns, Head and Shoulder, cup and handle, etc. Today, we will discuss 2 strong reversal pattern which hold good in different time frames. Though, higher the time frame, greater the impact.
Here’s a list of 2 trend reversal patterns-
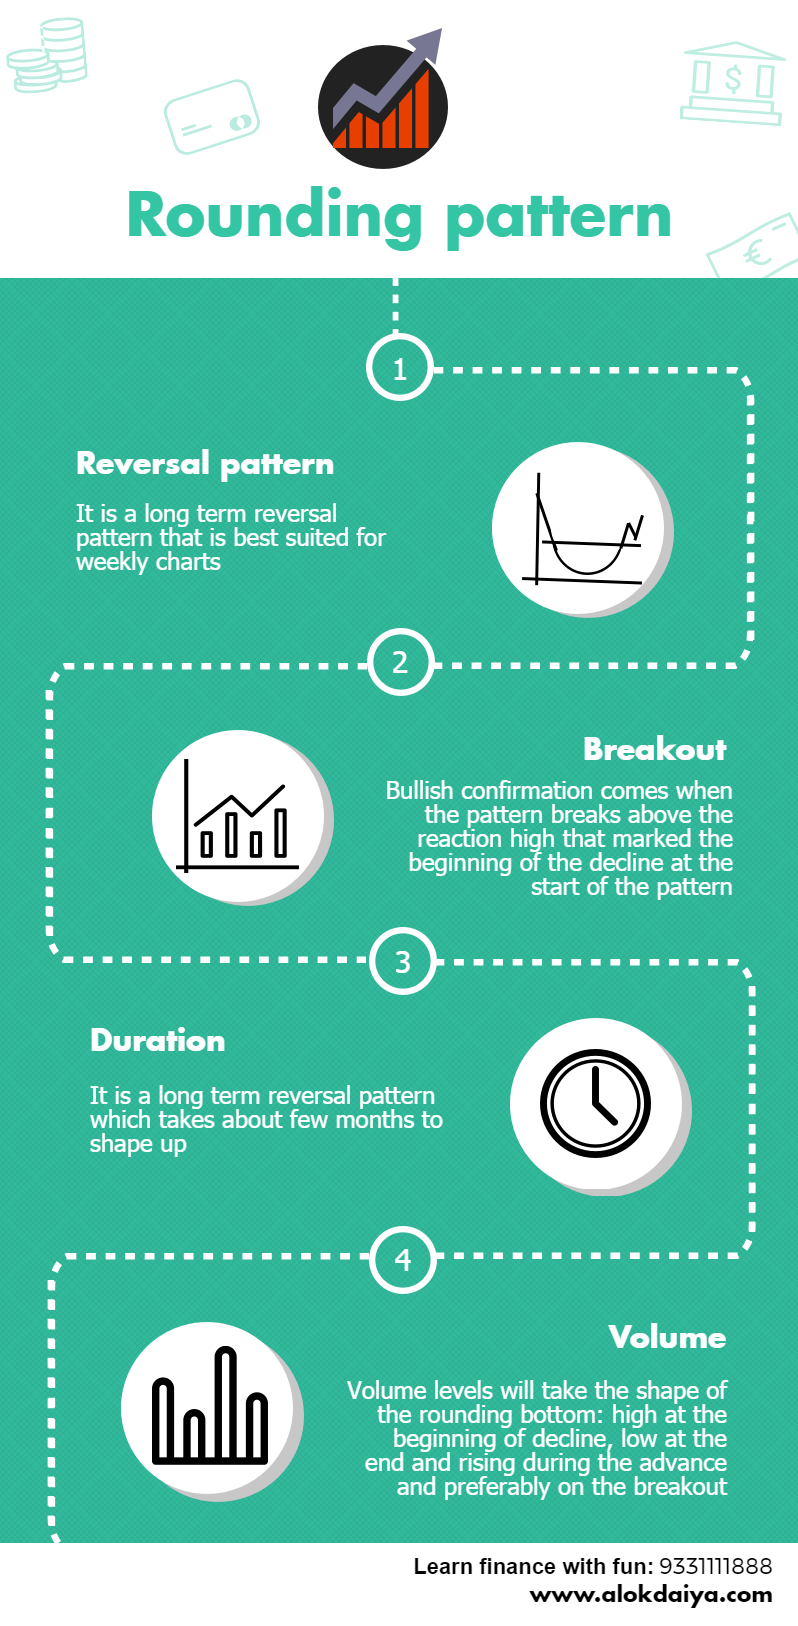
Rounding bottom
The rounding bottom pattern, which is also called a saucer bottom, is a rare long-term reversal pattern that is sometimes seen on long time-frame charts. This pattern usually takes several months to a few years to form. The length of time the rounding bottom takes to form makes it rather difficult to identify. Its appearance is similar the cup section in the cup and handle pattern. Unlike the cup and handle pattern, though, the rounding bottom usually appears at the end of a downtrend or during a protracted ranging market.
In the rounding bottom pattern, the rate at which prices decline slows and eventually turns up slowly before accelerating gently. These price movements are usually advances and decline with increasingly shallower lows initially followed by increasingly higher highs after the upturn. The time it takes to form the left half of the pattern, i.e., the slowing decline, should be similar to the time it takes to form the slowly accelerating right half of the pattern.
The volume accompanying this pattern is of important in confirming this pattern. The volume should be high at the start of the pattern and should weaken as the price decline slows toward the low. Once the price turns and starts to advance away from the low, volume should also increase.
The rounding bottom gives a long entry signal when the price breaks above the resistance level formed by the peak that marks the start of the pattern. At this point the downtrend is considered to have reversed and an uptrend should form.
Head and shoulder
This bearish pattern has three swing highs. The middle swing high is the highest.
1. Left Shoulder: Bulls push prices upwards making new highs; however these new highs are short lived and prices retreat.
2. Head: Prices don’t retreat for long because bulls make another run, this time succeeding and surpassing the previous high; a bullish sign. Prices retreat again, only to find support yet again.
3. Right Shoulder: The bulls push higher again, but this time fail to make a higher high. This is very bearish, because bears did not allow the bulls to make a new higher or even an equal high. The bears push prices back to support (Confirmation line); this is a pivotal moment – Will bulls make another push higher or have the bears succeeded in stopping the move higher.
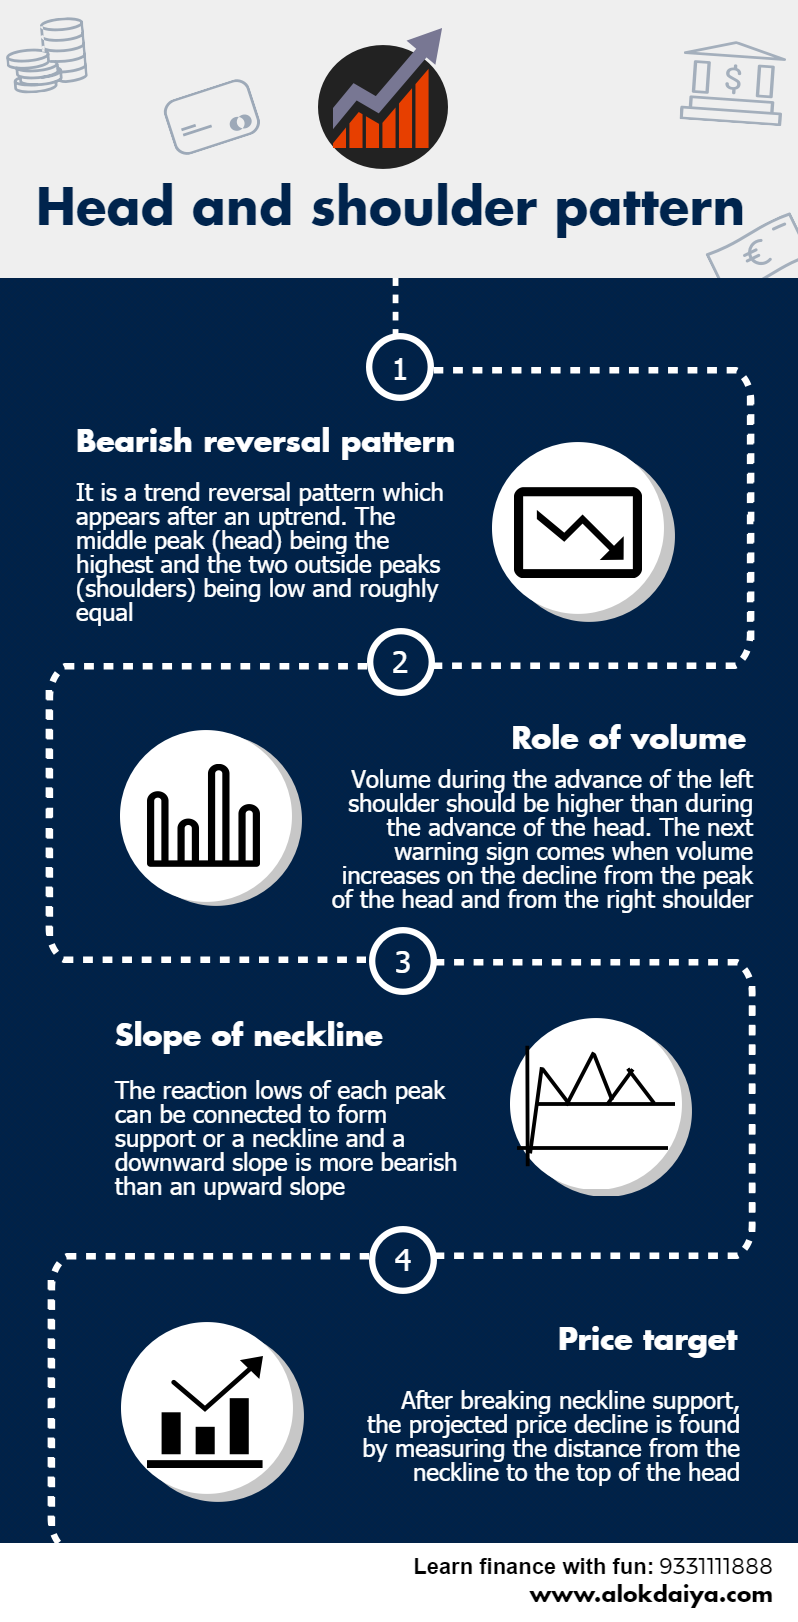
If prices break the confirmation support line, it is clear that the bears are in charge; thus, when price closes below the neck line, a potential sell signal is given.
Also read: How does psychology play a role in Stock market?
Note that a downward sloping neck line is generally seen as a more powerful Head & Shoulders pattern, mainly because a downward sloping confirmation line means that prices are making lower lows. Note that Volume should increase on break-out.For the target objective, measure the distance between the neckline and the head. Then, project the distance from the break-out point.
Bottomline
The above discussed Rounding bottom and Head and Shoulder pattern works as a strong reversal pattern but remember that most reversal patterns fail, especially when the trend is strong. Hence, it’s important to trade them very carefully. Don’t just trade simply on the basis of these patterns but use them in conjunction with volume and other technical parameters to validate their effectiveness.
You may also like

Financial Terminologies Starting with “L”

Financial Terminologies Starting with ‘K’