A comprehensive study on Support-Resistance and Principle of Polarity
Support and resistance shows key areas where the forces of supply and demand meet. In the financial markets, prices are driven by excessive supply (down) and demand (up).
Supply is synonymous with bearish, bears and selling while demand is synonymous with bullish, bulls and buying. As demand increases, prices advance and as supply increases, prices decline. When supply and demand are equal, prices move sideways as bulls and bears slug it out for control.
Support and Resistance
A support is a point or a place in the chart from where the fall in price stops and changes the direction to upward. This point is popularly known as support point or bottom. In fact all the support points are having demand which is much more greater than supply.
A resistance is a point or a place in the chart where the upward journey of the stock halts and reverses the direction to downside. Technically it is also known as top. This is the point where the supply is much greater than demand.
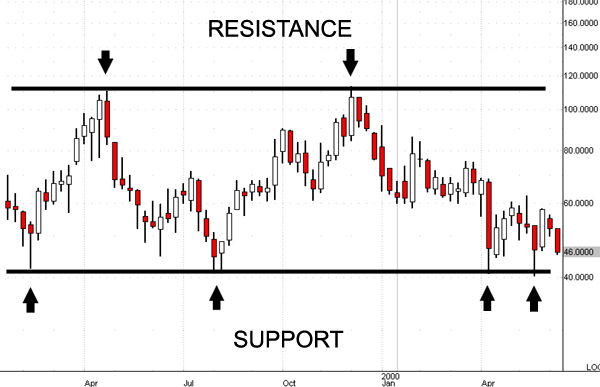
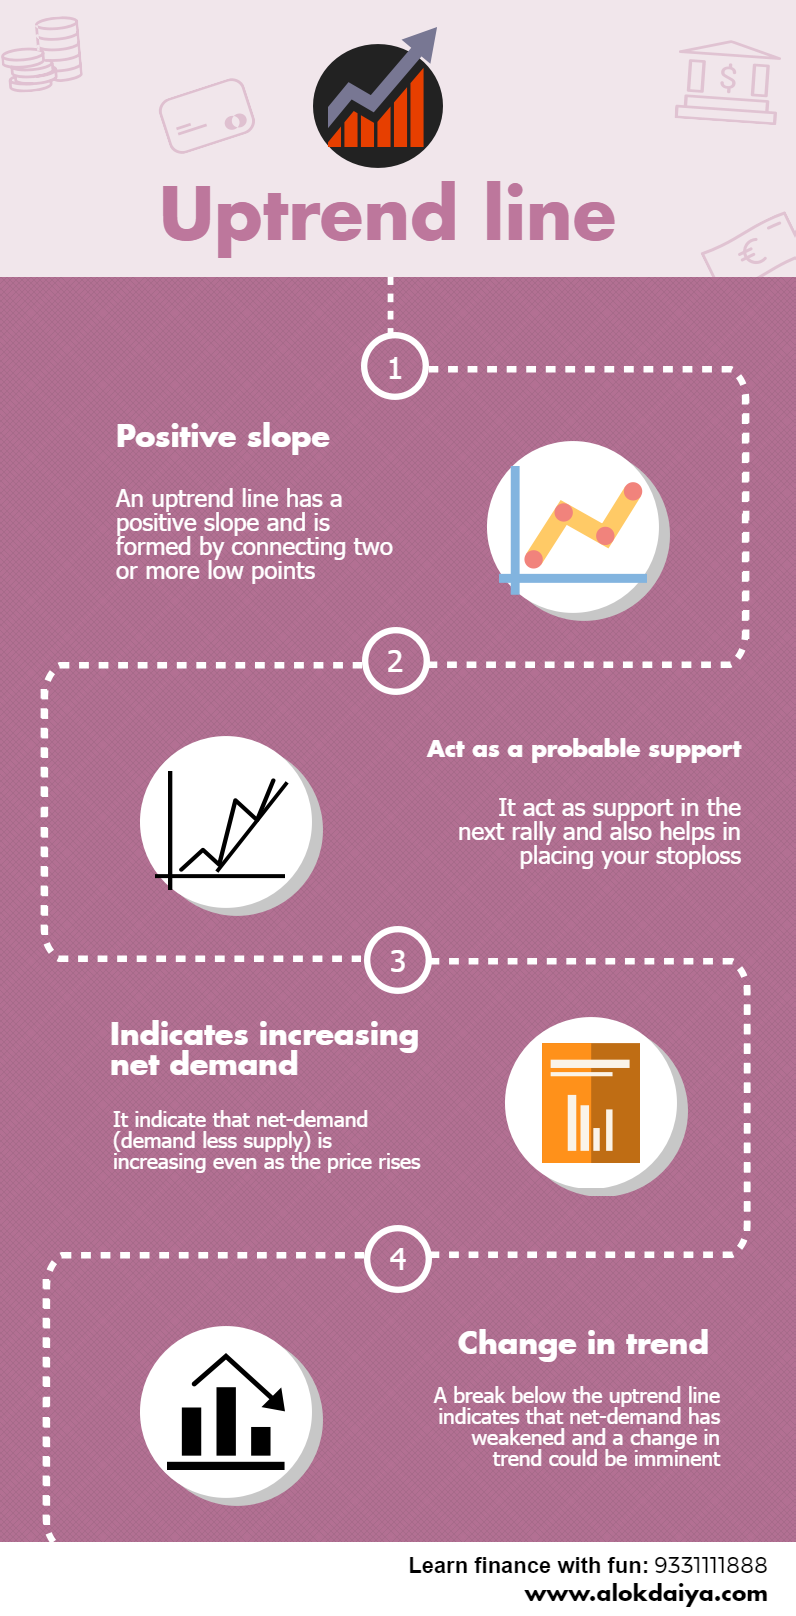
Uptrend and downtrend
We must note that price continues to move between this support and resistance. As long as the uptrend is in force, price will break resistance on the upside and will keep on making new highs.
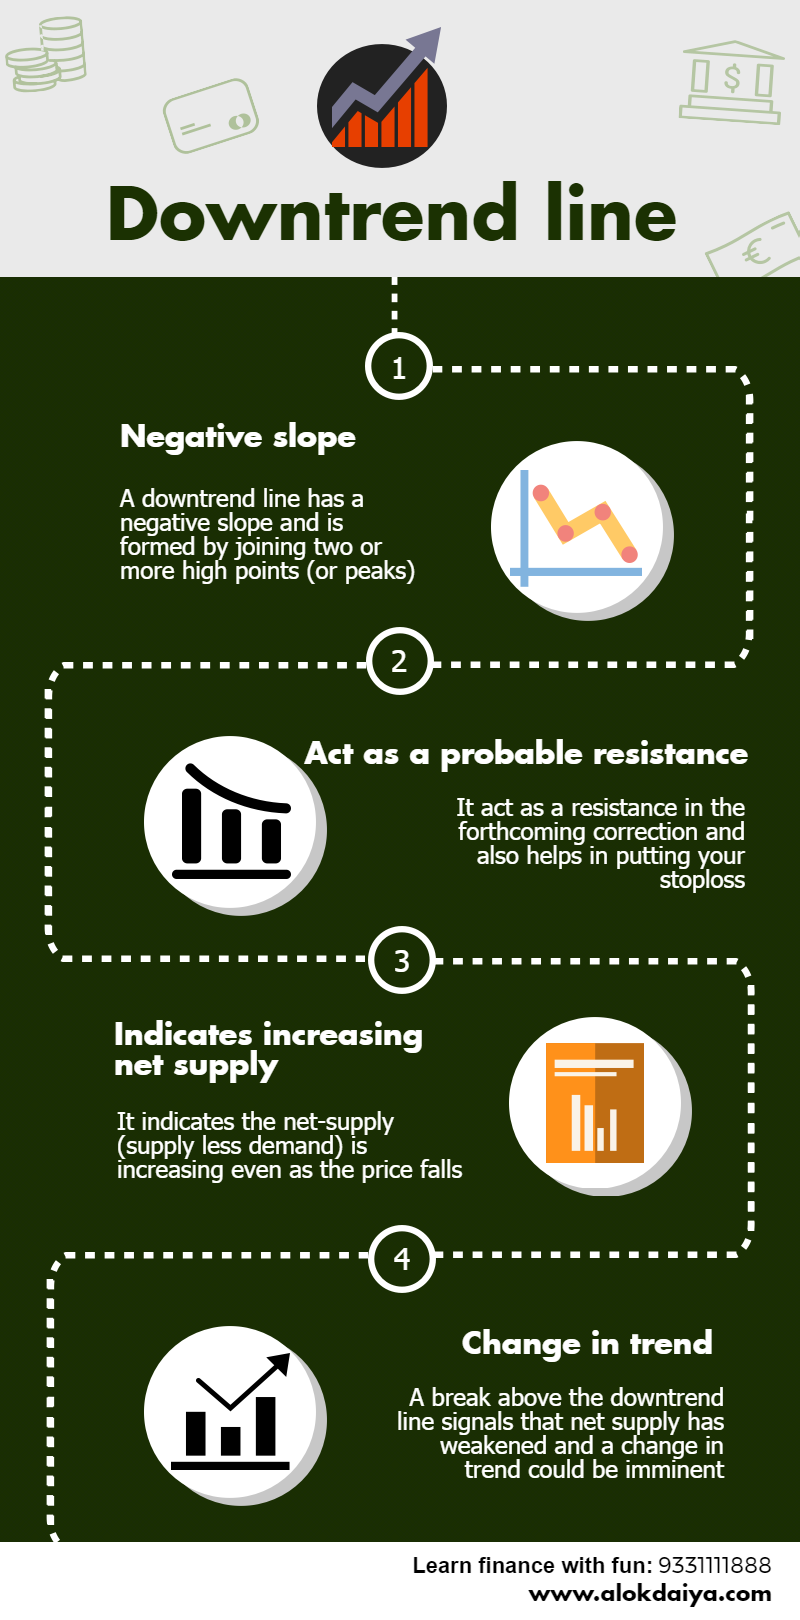
In a downtrend, when the price falls, it gradually violates one support level and goes to new low and accordingly carries on. We should not confuse that resistance is a point which can only be challenged as long as the trend is up. And support is a point which needs to be broken as long as the trend is down.
Methods of calculating Support and Resistance
There are some methods to calculate the support or resistance level. They are as follows-
1. We can apply theory of retracement to understand the probable support point.
2. We can take the help of trend lines to understand the probable support levels.
3. We can take the reference of the left side if there is any old previous bottoms or not because these old bottom is likely to work as double or triple bottom and thereby provide support.
4. We can also take the help of Moving Average. In fact during an uptrend, Moving Average works as support level.
On the other hand, during a downtrend, we can pin point the probable resistance point where the price likely to face obstacles. They are also as follows-
1. Take the help of retracement theory.
2. Use a downtrend line to see if the price has the ability to cross it.
3. Take the help of left side of the chart to find out if there is any old top or not. If it remains there, it is likely to work as a double top or triple top and provide resistance.
4. Apply moving average and it is obvious that during a downtrend, we will see that price is below the Moving Average (MA) and MA is falling. So even this MA, it will also produce resistance to the price.
Principle of Polarity
The interesting fact of support and resistance is that support in the previous operation is expected to work as support again in the next fall. This happens because once the support has proved to be successful, in future this support will again work as support but for any reason the support level is broken then it will become resistance point. This is called reversal of roles or “Principle of Polarity”.
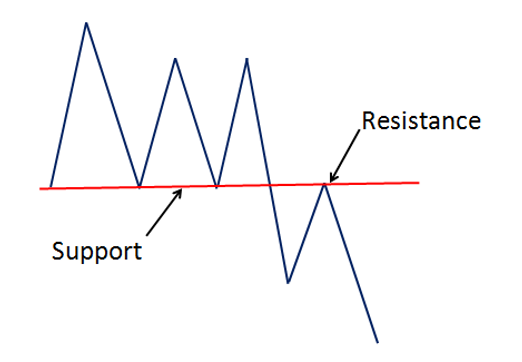
A support level is a place where some people had bought the share at some particular time and they were rewarded to sell those shares at a higher price. So in future when the price comes back to the support level, the general psychology of the people is to buy again because he remembers well that from this point he bought some shares and made some money. So it goes without saying that a rewarded buyer will always try to buy at the same level.
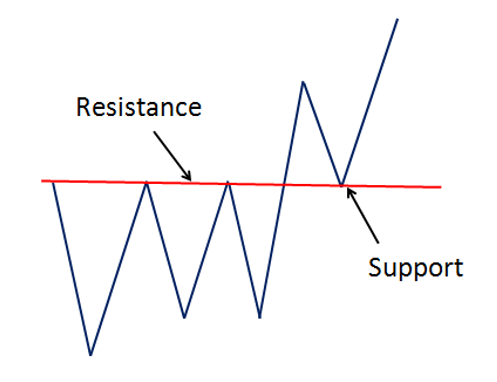
Once these support level is broken, first of all the buyer becomes confused so as to why did it happened. So now his motive is he doesn’t want any profit, he does want to sell at the buying rate so as to breakeven and thereby goes off. But in future, when price comes back to this level, who got trapped and have been waiting for quite some time to happen something, now wants to get rid of such price and offloads his holdings. Although price remaining the same, Mr A who was the buyer at point X, will now become a seller at point X.
So the basic understanding of this concept is once you identify support level and keep on buying or when the price hits downward, you immediately sell your shares to have a bailout package. This is called reversal of roles or principle of polarity in technical analysis. Hence in a single word, it can be said that a support once broken becomes resistance and a resistance once broken becomes support. This happen due to mass psychology and who have memories to fill or to know what has actually happened. Hence support and resistance are very delicate points to be handled with.
Conclusion
Identification of key support and resistance area is very essential concept in technical analysis. Even though it is sometimes difficult to establish exact support and resistance levels, being aware of their existence and location can greatly enhance analysis and forecasting abilities.
Say if a security is approaching an important support level, it can serve as an alert to be extra vigilant in looking for signs of increased buying pressure and a potential reversal. If a security is approaching a resistance level, it can act as an alert to look for signs of increased selling pressure and potential reversal.


4 Comments
Great information
Thanks Vishal for your feedback!
Make a more new posts please 🙂
___
Sanny